What is a Dendrogram?
In general, a dendrogram is simply a binary tree (i.e. a tree where every node has 0 or 2 children). In the present context, dendrograms are abstract representations of the hierarchical structures in a dataset.
Consider this cartoon, 2-dimensional cloud map:
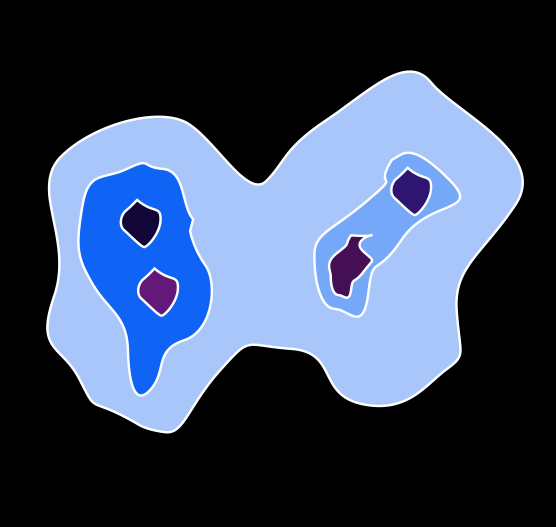
Imagine drawing several contour lines on this map. Each contour will trace 1 or more closed figures. As we draw contours at increasingly low intensities, these various shapes will grow larger and merge with one another. We can use a dendrogram to represent how these different contour lines merge with one another:
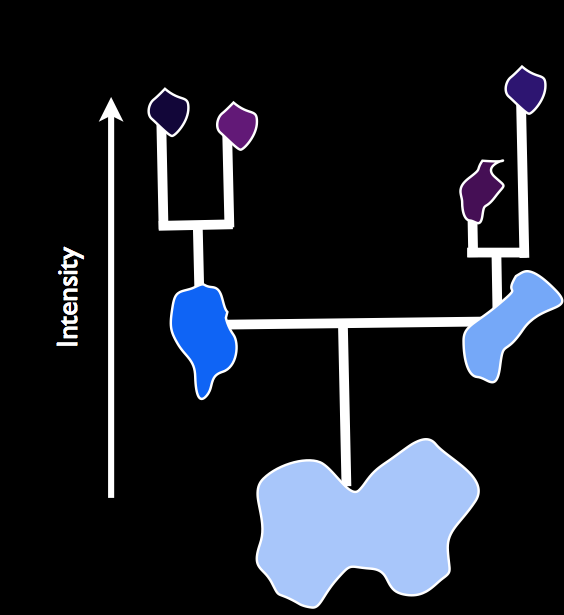
Each point on a vertical line corresponds to a specific, closed contour (the level of that contour is the height of the point). The branching of the tree matches the merger of contours – when two branches join at a height “y”, two contour lines merge at a contour level “y”.
The procedure works the same way for 3 (or N) dimensional data, but the contour lines become (hyper) surfaces.