Recipes
Dendrogram Indexes
The dendrogram algorithm segments data into nested structures. Each structure is given a unique integer identifier. The following routines help to navigate these indices.
Leafward Mergers
The leafward mergers of structure i are all the nodes in the sub-tree rooted at i. Each leafward merger passes through structure i when traveling to the root. Alternatively, any node that is visited on a trip from i to a leaf is a leafward merger of i.
To find the IDs of the leafward mergers of structure 60 (Note that 60 is included in the output):
print, leafward_mergers(60, (*ptr).clusters)
          60          15          56          55          20          22          53          52          25          51
          27          30          50          49          26          29          33
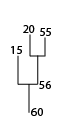

Partial dendrogram centered on structure 60, showing the first few leafward mergers.
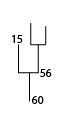
To find the two immediate substructures that merge to form structure 60, use the /parents keyword:
IDL> print, leafward_mergers(60, (*ptr).clusters, /parents)
     56          15
Rootward Mergers
Rootward mergers are the opposite of leafward mergers. They represent superstructures, or trees that a given node is nested inside.
Rootward mergers of 60:
IDL> print, rootward_mergers(60, (*ptr).clusters)
     60           61
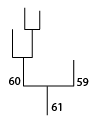
The rootward mergers of struture 60.
Siblings
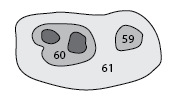
The structure that structure 60 eventually merges with:
IDL> print, merger_partner(60, (*ptr).clusters)
      59
The structure that defines the merger of structure 59 and 60:
IDL> partner = merger_partner(60, (*ptr).clusters, merge = m)
IDL> print, m
      61
Mapping between indices and pixels
Use the substruct function to extract which pixels belong to each dendrogram structure.
Find the indices (in the flattened x/y/v/t arrays) of the pixels belonging to structure 60:
IDL> ind = substruct(60, ptr)
IDL> help, ind
<Expression>    LONG      = Array[3195]
IDL> intensities = (*ptr).t[ind]
IDL> xpos = (*ptr).x[ind]
IDL> ypos = (*ptr).y[ind]
Find only the pixels that belong to structure 60, but none of its substructures (i.e., a slice of the onion):
IDL> help, substruct(60, ptr, /single)
<Expression>    LONG      = Array[262]
Warning
In the IDL dendrogram implmentation, the x,y,v values do not always correspond to the pixel locations in the original data (they are occasionally offset by a few pixels). While this is not the case for C++-generated dendrograms, you shouldn’t rely on using the x/y/v values to index into the original data. Instead, use cube_indices = (*ptr).cubeindex[ind]. This gives the (1D) indices into the original data
Here’s an example of how not to index into the original cube (see warning above):
IDL> print, im[xpos[0:3], ypos[0:3], zpos[0:3]]
  7.48933      8.81364      10.1202      6.45180
IDL> print, intensities[0:3]
   6.66389      6.71393      6.73340      6.74873  ;- DOES NOT MATCH!
And the proper way:
IDL> ci = (*ptr).cubeindex[ind]
IDL> print im[ci[0:3]]
   6.66389      6.71393      6.73340      6.74873
IDL> print, intensities[0:3]
   6.66389      6.71393      6.73340      6.74873 ;- matches.
Plotting
Get a set of (x,y) points to plot a dendrogram:
IDL> root = dendro_root(ptr)  ;- grabs the ID of the dendrogram base
IDL> xy = dplot_xy(ptr, root) ;- draw from the root
IDL> plot, xy[0,*], xy[1,*]
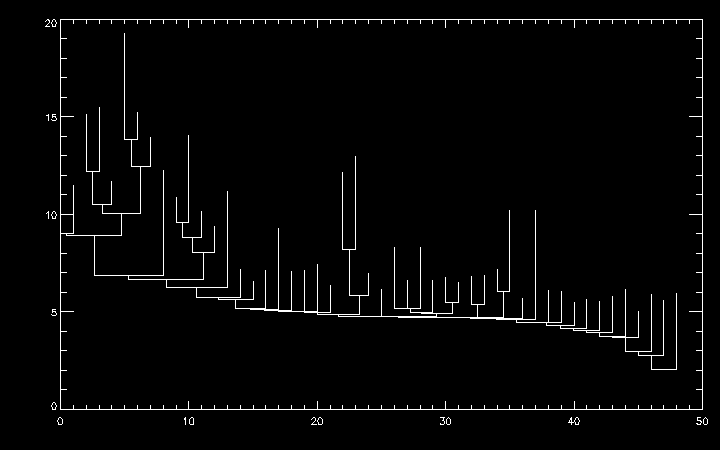
The height of each vertical line is the intensity value at which the two branches above it merge. The height of each leaf is the peak intensity of that leaf. The x ordering is arbitrary (see next section).
Re-ordering
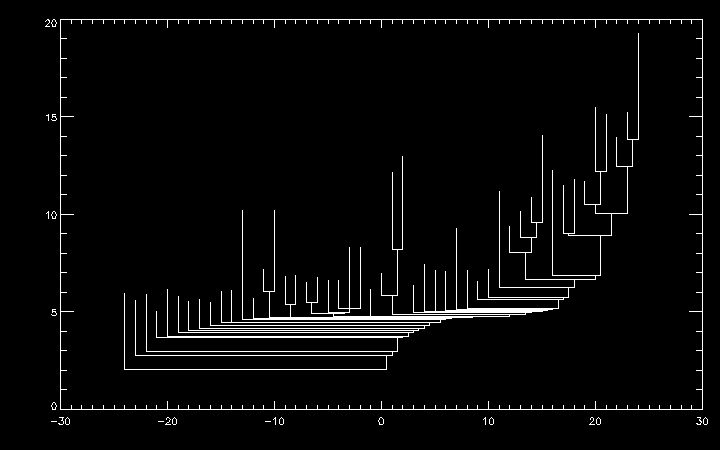
You can re-sort the dendrogram using dendro_sort. For example, to sort the dendrogram structure such that the left subtree of any node has an integrated intensity less than the right subtree:
IDL> dendro_sort, ptr, /inten
IDL> xy = dplot_xy(ptr, root)
IDL> plot, xy[0,*], xy[1,*]
dendro_sort also supports sorting based on the height of the tallest leaf in each subtree (i.e. the peak intensity of each substructure) via the /height option.
User-defined ordering
dendro_sort accepts a keyword, key, to support user-defined orderings. This should be an array, whose size is the number of structures in the dendrogram. The dendrogram will be sorted such that the left subtree of any node will have an associated key value less than the right subtree. For example, to re-implement the functionality of the /height keyword:
function height_key(ptr)
    nst = n_elements((*ptr).height)
    result = fltarr(nst)
    for i = 0, nst - 1 do begin
       result[i] = max( (*ptr).t[substruct(i, ptr)], /nan)
    return, result

 IDL> keys = height_key(ptr)
 IDL> dendro_sort, ptr, key = keys
Analysis
The low-level routines described in the Dendrogram Indexes section can be used to extract and measure properties of each substructure.
The dendro_catalog function measures some common information:
IDL> catalog = dendro_catalog(ptr)
IDL> help, catalog, /struct
** Structure <2dc78d8>, 16 tags, length=64, data length=64, refs=1:
   X               FLOAT           109.922
   Y               FLOAT           7.59273
   V               FLOAT           0.00000
   SIG_MAJ         FLOAT           8.83641
   SIG_MIN         FLOAT           2.96764
   SIG_V           FLOAT           0.00000
   SIG_R           FLOAT           5.12087
   AREA_MASK       FLOAT           265.000
   PERIMETER_MASK  FLOAT           93.8909
   FLUX            FLOAT           639.349
   PEAK_INTEN      FLOAT           5.92300
   VOL             FLOAT           265.000
   VIRIAL          FLOAT           0.00000
   SHOULDER_HEIGHT FLOAT           3.88697
   VOL_LEFT        FLOAT               NaN
   VOL_RIGHT       FLOAT               NaN
The function creates an array of structures, one for each dendrogram structure. The fields of this structure are:
- x: Intensity-weighted mean x position
- y: Intensity-weighted mean y position
- v: Intensity-weighted mean v position
- sig_maj: Semimajor axis of an ellipsoid approximation to the structure’s projection in the x/y plane
- sig_min: Semiminor axis of ellispe described above
- sig_v: RMS dispersion in velocity
- sig_r: sqrt(sig_maj * sig_min)
- area_mask: Number of pixels of the structure’s 2D projection
- perimeter_mask: Perimeter of this projection
- flux: Sum of intensities for all pixels inside the structure
- peak_inten: Maximum intensity inside the structure
- vol: Number of pixels inside the structure
- virial: Virial parameter (see note below)
- shoulder_height: Height of the vertical line connecting this structure to its merger in a dendrogram plot
- vol_left: Volume of left subtree
- vol_right: Volume of right subtree
Tip
dendro_catalog works in pixel units by default. The optional len_scale defines the linear scale of each pixel. If present, it will convert sig_maj, sig_min, and sig_r into physical units. vel_scale gives the velocity width of each channel, and will convert sig_v into physical units. flux2mass is a multiplicative factor to convert summed intensity into mass. It is used by virial (see next tip)
Tip
The virial parameter is defined as 5 eta R v^2 / (G M), where eta = 1.91 (see Rosolowsky et al. 2008). M is calculated by multiplying the flux field by the optional flux2mass keyword, and G is given in CGS units. Thus, to get sensible units for this field, use len_scale to convert from pixels to cm, vel_scale to convert from velocity pixels to cm/s, and flux2mass to convert to g.
This routine depends on functions in the Beaumont IDL library.